
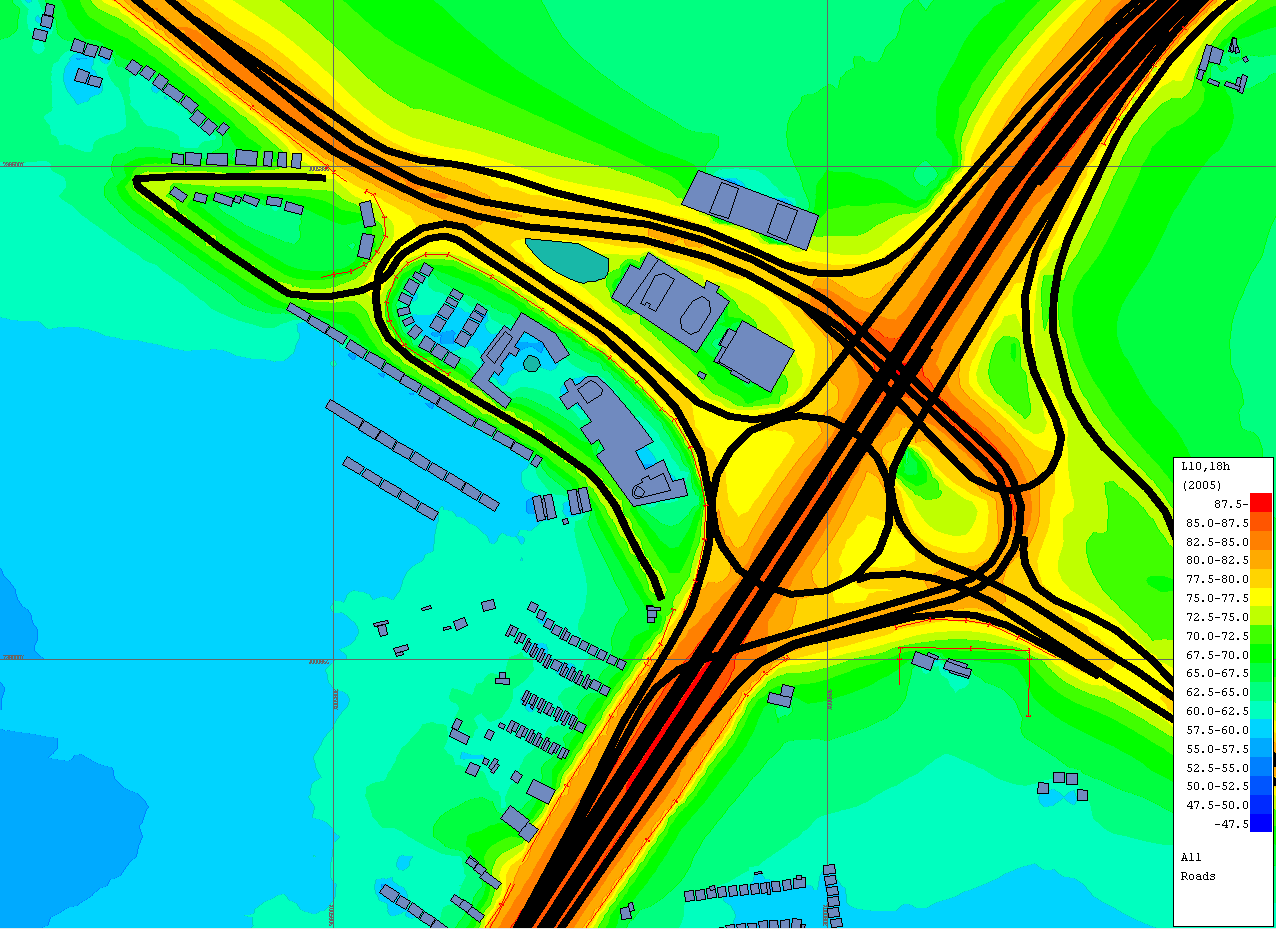
 Noise Contours
This Noise Map is coloured according to the noise levels in the area. The noise levels may be shown by contour lines that separate the different noise levels in an area.
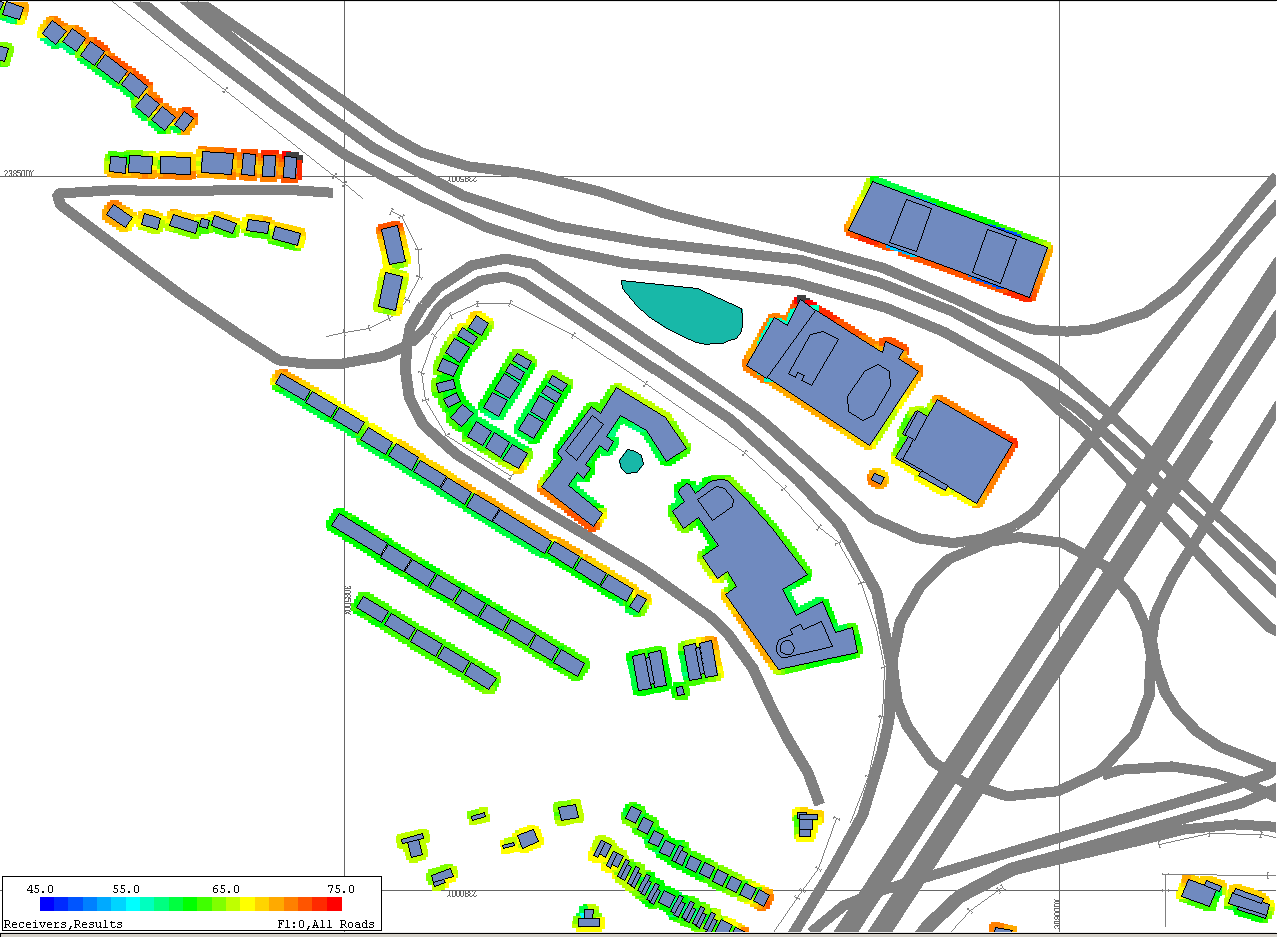
Receiver levels
This Noise Map shows the noise level at individual receptor points (receivers) – around the facades of buildings.
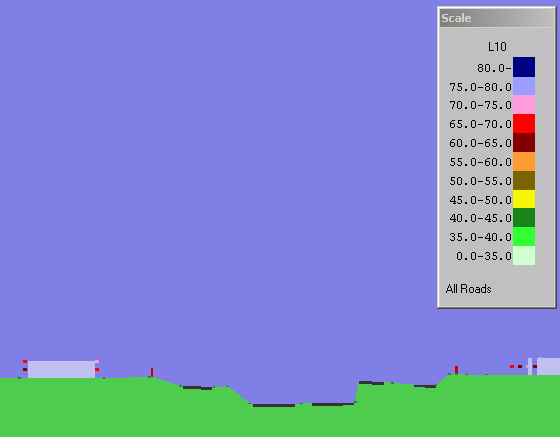
Cross-section
Cross-sections help with understanding the 3-D spread of noise. Here a cross-section of a noise model shows the noise levels at receiver points on the building facades.
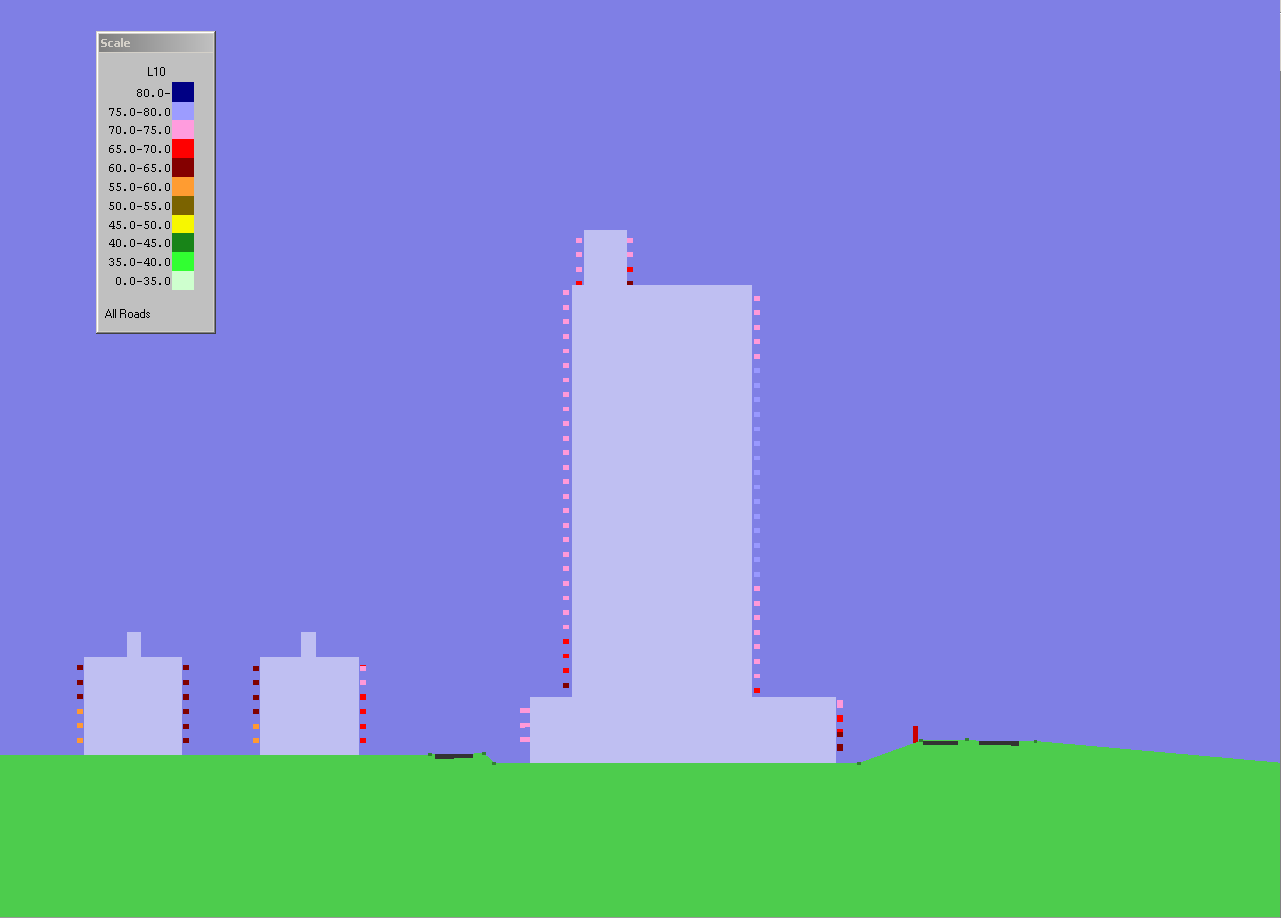
 Tall Buildings
Noise levels can be calculated at receiver points up the façade of a tall building to see how noise levels change. These give a quick over-view of complex situations.
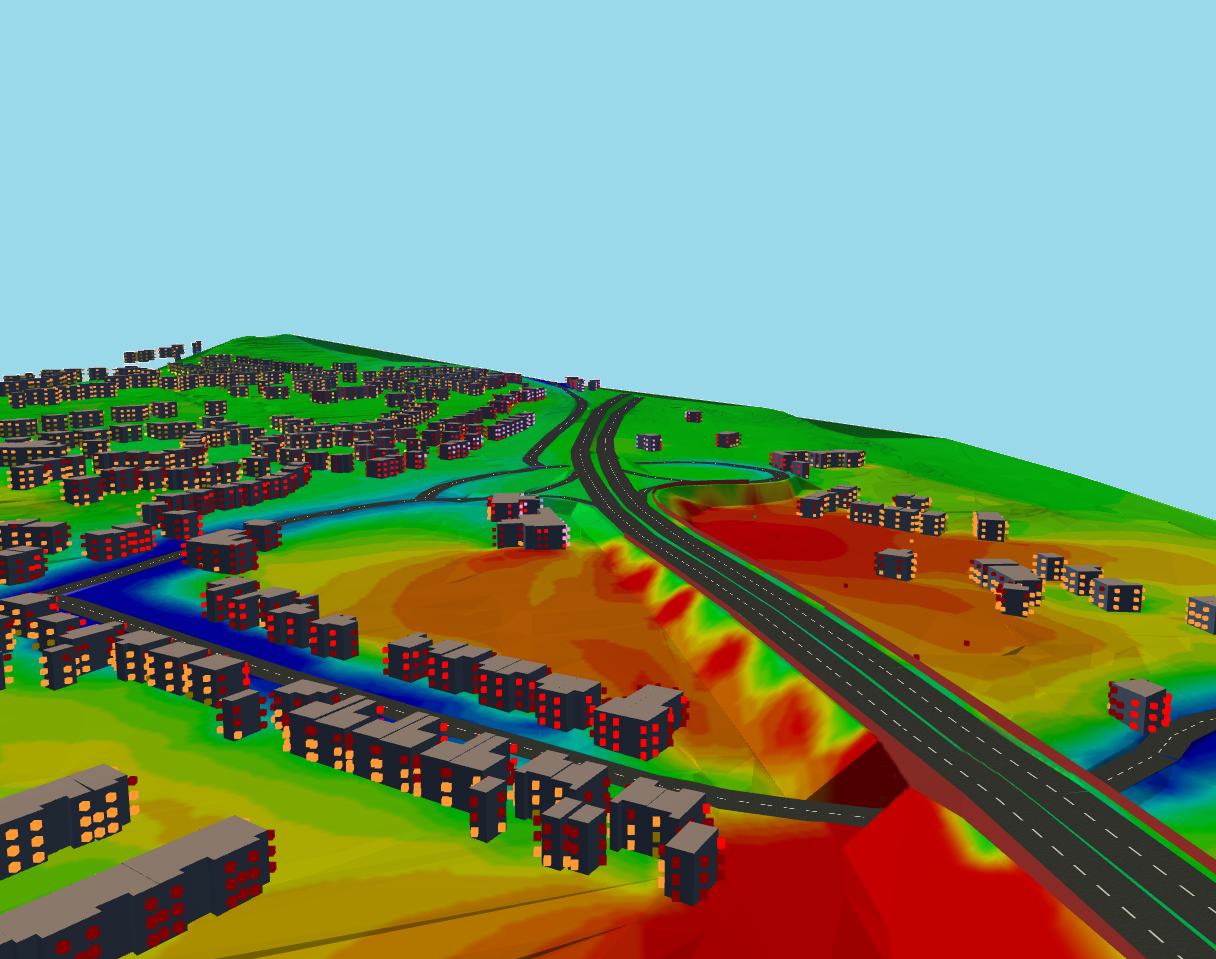
3-D views
These are a good way to show the spread of noise. Here, we can see the spread of noise from a complex interchange as both contours and receiver noise levels.
 Change of level
Here a barrier has been installed along the main road. Red colours show where the barrier reduces noise levels and blue colours show where it has had no effect due to noise from the side roads.
Averages
The noise levels over an area will be varying all the time. For example, noise levels may rise as a vehicle approaches, and reduce again after it has passed. This would cause a short-term variations in noise level. In the slightly longer term, noise levels may be higher in peak periods when the roads are busy, and lower in off-peak periods. Then again, there is a greater volume of activity from more people and traffic in the day-time than in the evening or at night. In the longer term, wind, weather and season all affect noise levels.
This means that it is not possible to say with certainty what the noise level will be at any particular point at any instant in time, but where the noise sources are well-defined, such as road or rail traffic, or aircraft, then it is possible to say with some confidence what the long-term average noise level will be.
NoiseMap can calculate the noise level for each hour through the day. This is shown in the following video which show the noise contours between two roads. It starts at at midnight and goes through the whole 24 hours.
Measurement or calculation?
Although it may seem that best way of doing this is by measurement, experience shows that this is not the case. For a start, a long-term average must be measured over a long period of time. Secondly, to obtain complete coverage of an area, measurements would have to be made on private property, where access might be difficult, and thirdly, measurements cannot distinguish the different sources of noise, so they would not be able to give information on how much noise was being made by each of the sources in an area.
For these and other reasons, noise mapping is usually done by calculation based on a computerised noise model of an area, although measurements may be appropriate in some cases.
Designing noise mitigation
A further benefit of having a noise model is that it can be used to assess the effects of transportation and other plans. Thus the effect of a proposed new road can be assessed and suitable noise mitigation can be designed to minimise its impact. This is particularly important in noise action planning, where a cost-benefit analysis of various options can be tested before a decision is made.