
NoiseMap 5.2 lets you process results for individual receivers and show them on screen.
The ManualExampleDatabase supplied with NoiseMap contains some results calculated for individual receivers. Suppose you want to calculate and show the change of noise level at these receivers resulting from building the new road. You can set up a results expression to calculate this change and then show the result at every receiver in the model. You can display this on the screen as shown here:
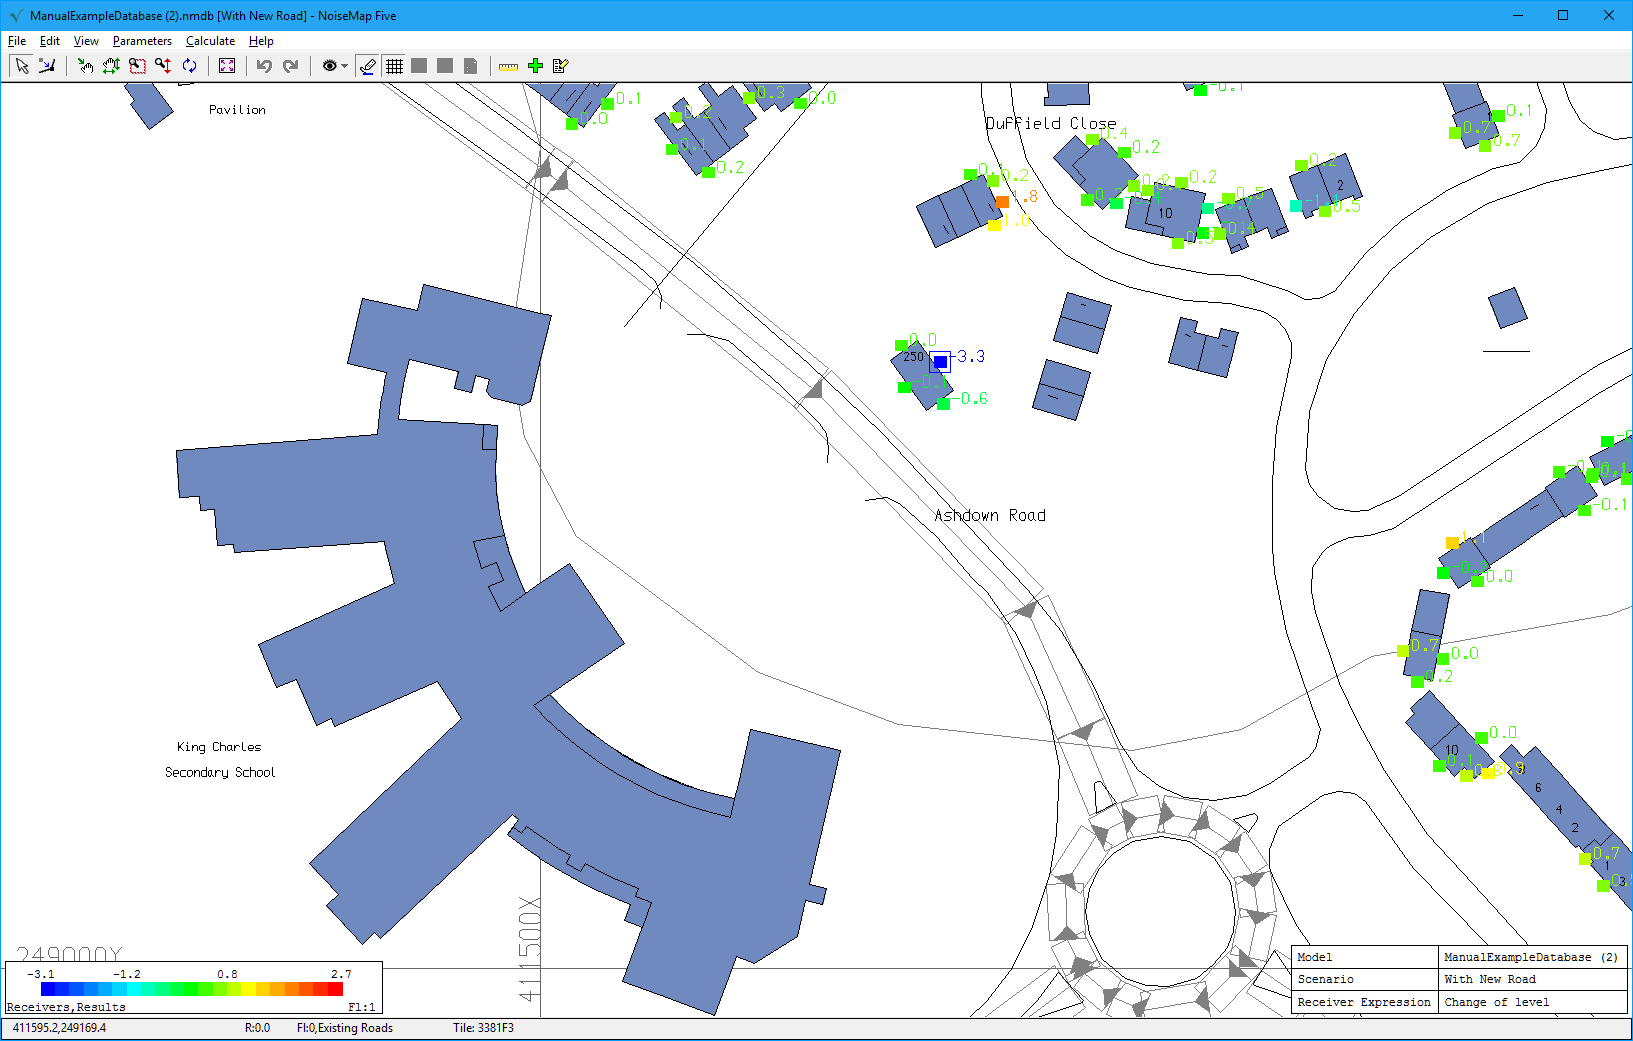
You can select any receiver and see the result in detail:

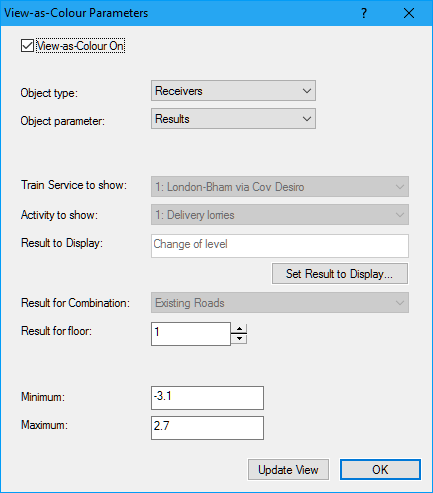
View-As-Colour lets you choose which result to colour on-screen:
How do you create a results expression?
Firstly you need to calculate some receiver noise levels. Then select ‘Load Receiver Results’ and in this case load the noise calculations for ‘Existing’ and ‘New Road’ scenarios.
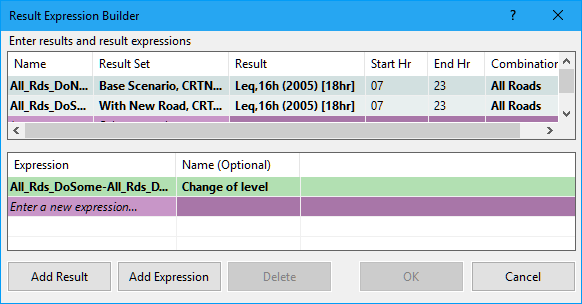
Then go to the ‘Results Expression Builder’ and select the noise index that you require, in this case LAeq, 16h, and the combination, in this case ‘All Roads’. The change of level is then given by subtracting the ‘Do Nothing’ result from the ‘Do Something’ result. Click OK and this calculation is immediately applied to all the receivers and can be viewed on-screen. This result can also be exported to a file.
This is immensely powerful and can save many hours of work with a spreadsheet.