
WHAT IT DOES
You often need to process the results of your noise modelling in order to draw some conclusions about the noise impact of the project. NoiseMap quickly creates a large amount of noise information, so you may need some assistance in getting meaningful conclusions.
This is where the Results Processor comes into play. This is an advanced new feature in NoiseMap 5.2 which greatly enhances the ‘Compare Contour’ function of earlier versions of NoiseMap.
It also lets you calculate and compare changes of noise levels at individual receivers, a new feature.
The Results Processor can produce more meaningful noise contours and can replace the use spreadsheets in many cases.
WHAT SORT OF RESULTS PROCESSING CAN YOU PERFORM?
The results processor works on both noise contours and noise levels at individual receivers.
In summary, the Results Processor lets you:
Add or subtract a fixed amount to each result;
Add or subtract any two or more results;
The addition or subtraction can be arithmetic or logarithmic;
Take the average value of two or more results;
Take the larger or smaller value of two or more results;
Calculate a new value based on comparing one result with another;
You can download any number of sets of results to do comparisons between multiple sets of results.
CONTOUR RESULTS PROCESSING
You may try out these examples from the ManualExampleDatabase.nmdb database supplied with NoiseMap.
CONTRIBUTION OF NEW ROAD TO CHANGE OF LEVEL
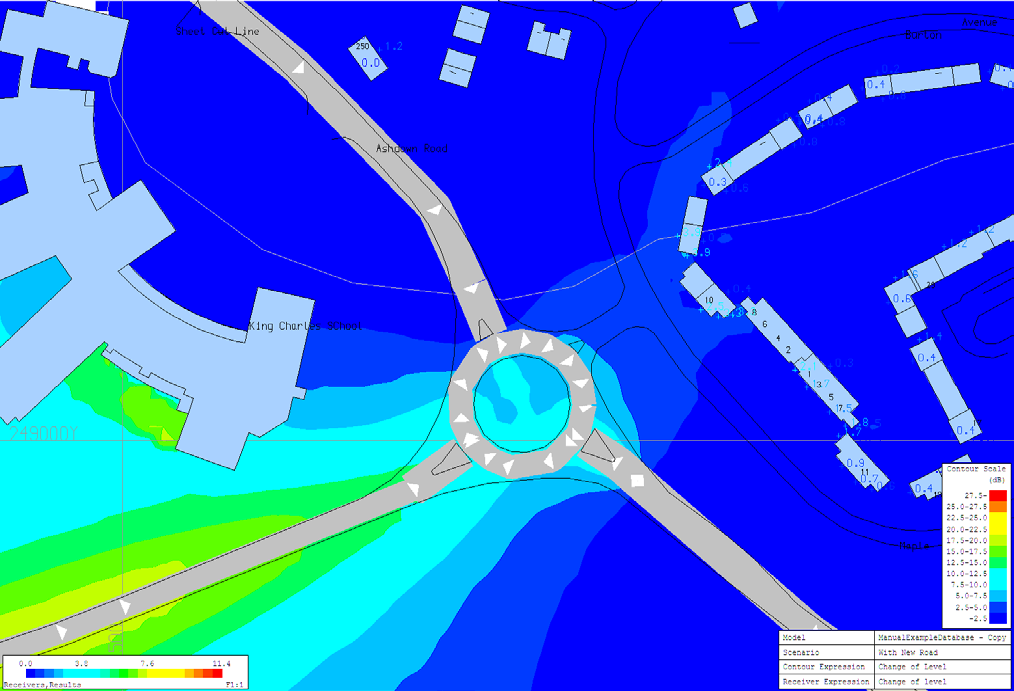
This example shows how noise levels have increased alongside a new link road. This has been calculated by arithmetically subtracting the contribution of noise of existing roads from the total future noise level. Note that the increase in level is also shown at the receiver points, being as high as 3.9 dB at this location.
The contour and receiver results can be exported for use in spreadsheets and reports.
The Results Expression used here is simply:
R1-R2
where R1 is the Total Future Noise Level and R2 is the noise level from existing roads.
Note that this result is not the same as showing the contribution of noise from the new road. In areas where the noise from existing road is very high, a large contribution of noise from the new road may not have a significant effect overall.
EXCEEDANCE OF A TRIGGER LEVEL
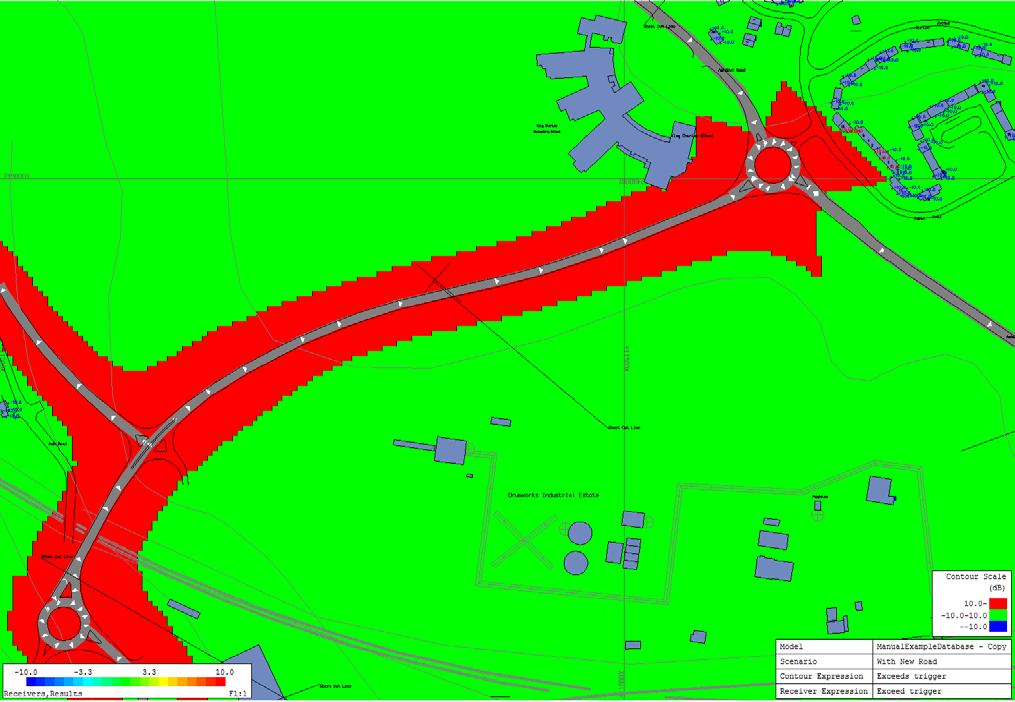
This example shows areas where the future total noise level is greater than 60 dB and the contribution of noise from the new road exceeds 1 dB.
The results expression is:
if(((r1-r2)>1 and r1>60),10,-10)
where r1 is the Total Future Noise Level and r2 is the noise level from existing roads.
Note that the value of 10 is applied where the trigger is exceeded – this is shown in red on the map. A value of -10 is applied where the trigger is not exceeded.
Interpolation of results is ‘switched off’ of setting the Contour Display Parameters to show ‘Unsmoothed Contour Data’ and the automatic colour generation is overridden by selecting to display only contour values of -10 and 10.
SHOWING TRIGGERS AT RECEIVERS
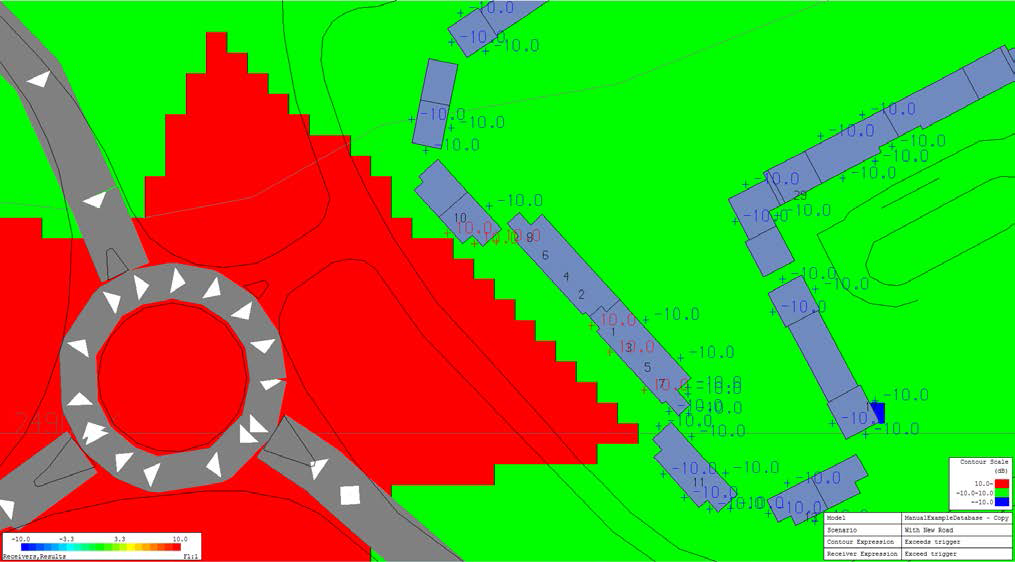
Exactly the same procedure is applied to individual receiver results. The results shown on the above map apply to first floor receivers and it can be seen that noise levels on the façade facing the new roundabout do exceed the trigger. [Ground floor receivers do not exceed the trigger, which corresponds to the noise contour.]
INDUSTRIAL NOISE

This shows the contribution of noise from an industrial site, relative to the total noise level in an area.
Two results sets were loaded:
R1 = Total Noise from All Roads – LAeq 16 h parameter chosen
R2 = Industrial site – LAeq 16-h calculated
The Results Expression is:
R1 = logsum(R1,R2) – R1
This is the total noise level from All Roads and the Industrial site, less the noise from the industrial site alone – i.e. the effective contribution of noise from the Industrial site.
It can be seen that the effect of the site is very localised.
HIGH-FREQUENCY NOISE
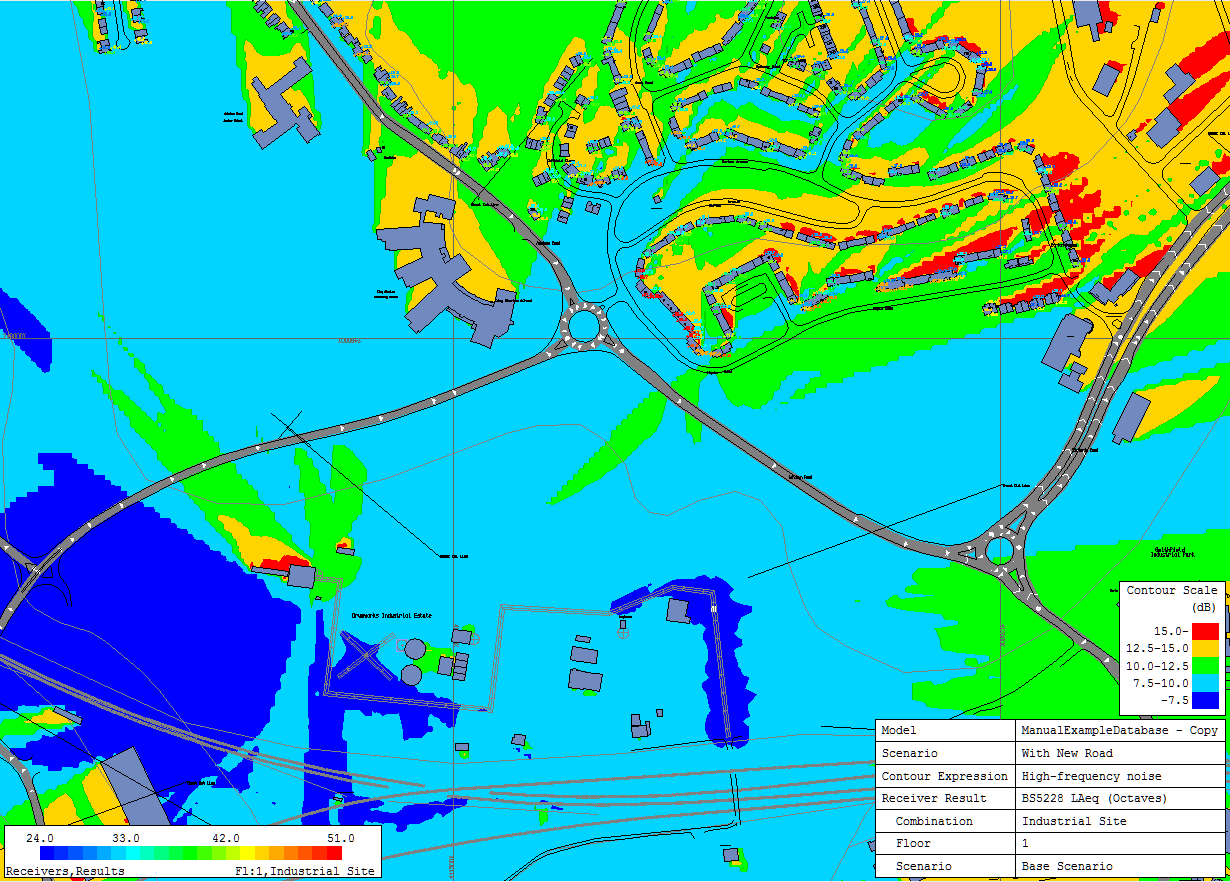
In this example, we are looking at where high-frequency noise from the site might be dominant. (This does not mean that it would be audible, as the previous example shows that traffic noise is dominant in most of the area.)
Two Results Sets were loaded:
R1 – BS5228 LAeq
R2 – BS5228 Leq (2kHz)
The Result Expression was:
R1 – R2
with the name ‘High-frequency noise’.
OTHER EXPRESSIONS
NoiseMap allows highly-sophisticated expressions to be created. Because Result Expressions can be quite complex, you can save them for re-use with the Script Interface.
The following sections of this guide give more details on creating and using Results Expressions.
USING THE RESULTS PROCESSOR
Firstly you will need to create a noise model and calculate some results – either noise contours or results at individual receivers. These results will have been stored in the database.
The first step in using the Results Processor is to download the results from the database, using the Results Explorer.
When you download results from the database, you get the complete set of results for the scenario/ tiles/ calculation/ combination that you have chosen. For this reason it is called a Result Set.
LOAD DATABASE RESULTS – RESULTS EXPLORER
Open the Results Explorer by selecting
Calculate> Load Database Contours, or
Calculate> Load Receiver Results.
This very powerful tool shows, for the whole database:
All the scenarios
All the calculation methods that have been used
For Noise contours, it also shows:
The grid-size resolution of all calculated noise contours
The height of the noise contours
The category combinations of calculated contours
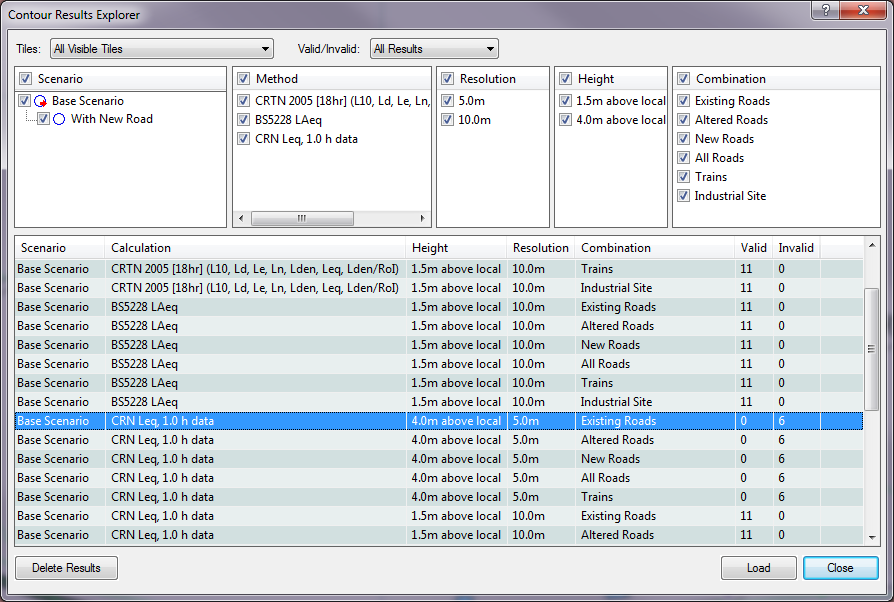
PROCEDURE
Firstly, filter down to the calculations of interest by ticking the boxes alongside the relevant criteria.
Select the tiles of interest from the Tiles selector at the top of the window. The options are:
All visible tiles (default)
All loaded tiles
All populated tiles in model
All populated tiles in scenario
Named areas
You can also select tiles in the graphical window using the mouse.
You may also select results according to their validity – Valid, Invalid or All Results: see below for an explanation of ‘validity’.
The lower part of the window shows the available results. Highlight the Result Sets that you wish to work on. You can select several lines at once. They will be loaded into NoiseMap.
Note that when loading Noise Contours, you have to select each combination that you want to work on, but when loading Receiver Calculations, you only need to select the scenario and calculation method – all the combinations are loaded simultaneously. You select the combination of interest in a later step.
For more information on using the Results Explorer, click on the ? button to open context-sensitive help, or consult the main User Manual.
Once you have loaded the result set, you can choose simply to display that result, or you can start to process it. For help on simply displaying a result, use the context-sensitive help or consult the User Manual.
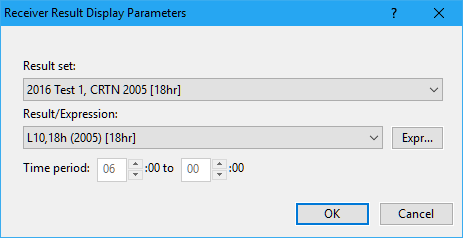
PROCESSING A RESULT
This section details how to process a result set once you have downloaded it. First, select Receiver Result Display Parameters from the Calculate menu and the following dialog opens:
For Noise Contours, the contour Display Parameters dialogue opens:
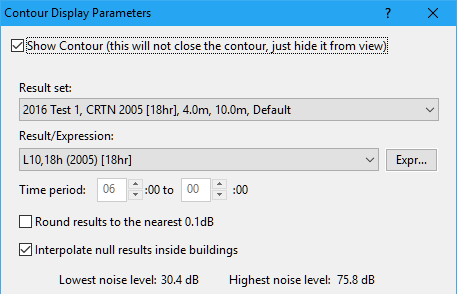
In either case, click on the button Expr…to open the Expression Builder.
You can now create a processing expression to create many different types of result.
CREATING A RESULTS EXPRESSION
Once you have downloaded some results as described in the previous chapter you can process them. This chapter describes how to create a results expression to do that processing.
ADD AN OFFSET
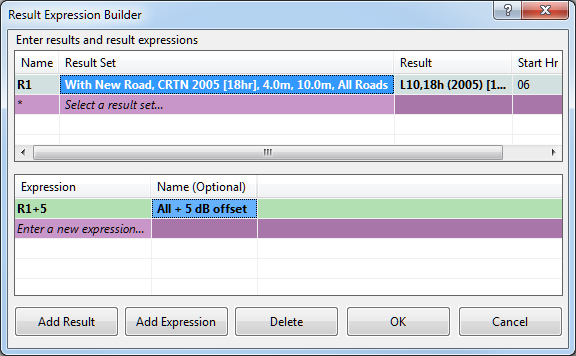
The simplest processing is to add a fixed offset to a result. First, you load the required result from the database. Suppose this is the ‘All Roads’ scenario from the ManualExample Database and you wish to add a 5 dB offset to all the results. Click the Expr…button on the Contour Display Parameters dialogue and the Expression Builder opens. Select the All Roads result set and note that it is given the name R1 (you can edit this name if desired).
Now, in the expression window below, enter R1+5. This means add 5 dB to all values in result set R1, (All Roads). You can give a (user-friendly) name to this expression: if not, the expression itself is shown. Here, the chosen name is All + 5 dB offset. This will be shown in the information panel on the main screen.
Click OK. You will now see that the contour display parameters show the Result Set as Result Expression and the selected expression is All + 5 dB offset. This will be plotted as a contour.
NOISE CHANGES
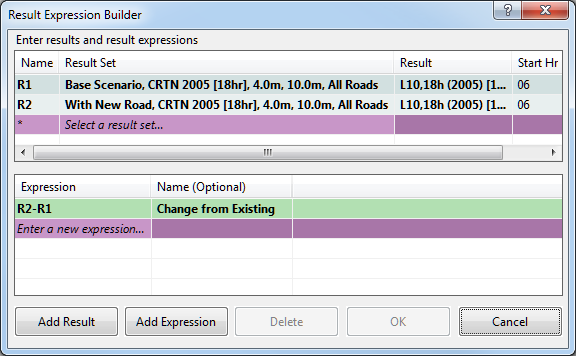
Another common requirement is to subtract two contours to find the change of noise level between two scenarios. Firstly, using the ManualExample model, go to Load Database Contours and load the two scenarios – say All Roads in the Baseline scenario and All Roads in the With New Road scenario.
In the Contour Display Parameters dialogue, click Expr…and in the Expression Builder, select the two sets of results, which NoiseMap will call R1 and R2 respectively.
Then under Expression type the expression R2 – R1, and call this Change from Existing, see the dialogue below
Click OK to return to the Contour Display Parameters window and click apply to see the resulting contour.
COMBINING NOISE CONTOURS
Note that in the above examples, the + and – operators add and subtract the noise levels arithmetically.
Another common requirement is to add two contours together to get the combined noise level. Here the requirement is a decibel addition, which is performed by the LOGSUM function. The Expression to do a decibel addition of two noise levels is
LOGSUM(R1,R2)
Note that you can sum as many results as you require and this can include a numerical value, e.g.
LOGSUM(R1,R2,R3,30.0)
ADD A NOISE FLOOR
At larger distances, there can be a loss of precision in the calculated results. This can result in ‘jitter’ in the change of noise level which appears as random patches of different colour. You can avoid this by setting a noise floor. For example, you may decide that results below 30 dB are beyond the precision of the model. If you set 30 dB as the noise floor, then any results below 30 dB are set at 30 dB. Thus if two results are at 25 and 28 dB, both are set to 30 dB and the difference will be plotted as zero.
The expression to set a noise floor of 30 dB to result R1 is
MAX(R1,30)
This means ‘use the greater value of R1 or 30’.
NULL RESULTS
Results sets can often contain ‘null’ results. This means a situation where no noise level has been calculated. It is represented in the database by a value of -99, as 0 dB would be a valid (and potentially audible) noise level. Null values can occur in many ways, such as
A tile was not calculated;
A receiver point was outside the angle of view or beyond the cut-off distance;
The receiver point was inside a building.
NoiseMap lets the user process null results in an orderly manner, as follows.
All arithmetic operations on any null value return a null result.
Thus 60 dB + NULL = NULL
However, the log functions operate slightly differently, eg
LOGSUM(R1,NULL) = R1
This is because NULL is treated as ‘no noise contribution’ (effectively as zero noise), so the total noise is the total of the other non-null values.
You may want to ensure that there are no NULL values, to avoid getting NULL as a result. You can do this with the COALESCE function. For example
COALESCE(R1,R2,35) would use the value of R1 unless it is NULL, in which case it would use the value of R2. But if that is also NULL, it would use the value 35. Essentially, this is saying ‘use the value of 35 if there is no other calculation for this point’.
OTHER OPERATIONS
| Other common Arithmetic Operators and Functions are available in the Results Processor: see the table below. Conditionals such as Greater than, Equal to and IF provide sophisticated processing possibilities, especially if combined with imported receiver point levels that could be used as noise criteria. Arithmetic Operators | |
| + | Arithmetic unary and binary add |
| – | Arithmetic unary and binary subtract |
| * | Multiply |
| / | Divide |
| ^ | Power (eg. R1^2) – can also use ** |
| ?? | Coalesce binary operator (see COALESCE function) |
| Boolean Operators – 0 is false, non-0 is true, eg. NOT(42) = 0, NOT(0)=1 | |
| NOT | Boolean invert – can also use ! operator |
| AND | Boolean AND |
| OR | Boolean OR |
| Conditionals – return 0 for false, 1 for true | |
| = | Equality – can also use == |
| <> | Inequality – can also use != |
| > | Greater than |
| < | Less than |
| >= | Greater than or equal |
| <= | Less than or equal |
| Functions | |
| MAX | Returns highest value of parameters – two or more parameters |
| MIN | Returns lowest value of parameters – two or more parameters |
| AVE | Returns arithmetic mean of parameters – two or more parameters |
| IF | Takes three parameters – the first is evaluated as a boolean used to select the second parameter when true, or the third when false, eg. IF(R1>42, 1, -1) returns 1 whenever R1 is greater than 42, or -1 when less than or equal to 42. |
| LOG | Returns the Log10 of the single parameter |
| LOGSUM | Returns logarithmic sum of the parameters – two or more parameters |
| LOGDIFF | Returns the logarithmic difference of two parameters, P1-P2 |
| LOGAVE | Returns logarithmic mean of the parameters – two or more parameters |
| COALESCE | Returns the first non-null parameter reading from left – two or more parameters |
| ISNULL | Returns True (1) if NULL. Returns False (0) if valid value – one parameter |
ENTERING EXPRESSIONS VIA THE SCRIPT EDITOR
Complex expressions might be prone to typing errors, so it can save time if they are stored for re-use. You can do this by using a Script Command, which you can type in Script Command Pane (at the bottom of the Results/Output Log window), or you can create the script in an external editor and run it from the File>Run Script menu item.
The script command for loading a receiver results expression is
display results expression=”anexpression”
This adds the new expression to the expression builder window and sets the expression as the headline value. Note that you must already have loaded the results from the database, using either the appropriate dialog or the script interface, so that the variables (R1, R2, etc) are available.
For contours, the script command is:
display contour expression=“anexpression”
For further information on using the Script interface, see the context sensitive help or the Script Interface manual, which has more information on results processing.
EXAMPLES OF SIMPLE EXPRESSIONS
Examples of simple expressions are:
R1+10 — increase value of result R1 by 10 dB
R2 – R1 – get change of noise level from R1 to R2
LOGSUM(R3,R4) get the cumulative level of R3 and R4
MAX(R3, 35.0) – put a noise floor of 35 dB on result R3
MIN(R4, 80) – put a ceiling of 80 dB on result R4
You can nest expressions, for example
MAX(MIN(R4,80),35) constrain the values of R4 to between 35 and 80 dB.
You can also produce conditional results e.g.
If(R3<67.5, 0,1) produces the result 0 if R3 is less than 67.5 and the result 1 if it is greater than or equal to 67.5
A test for noise insulation might be given by:
If((R3>=67.5) and (R3>=(R1+1)), 1,0)
It can be seen that there is great flexibility in this.
RESULT EXPRESSION BUILDER
To create an expression, click the Expr button to the right of the Result/Expression line and the Result Expression Builder will open.
Choose the results sets
First click on Select a result set. This will show the name of the Results set you have downloaded. Select this and it will be shown as Result Set R1. To the right, under the column Result will be the Noise index. This is a drop-down list. Select the index that you require, eg Lday. The start and finish hour in this case are defined by the procedure and cannot be changed, but in other indexes it might be possible to change these. The Combination is also a drop-down and will list all the combinations in the results set. Select one, eg All Roads.
Now go back to Result set again, and select the same results set, but this time, under Result, select Lnight. Select All Roads for the combination. This will be shown as Result Set R2. The Results set names R1 and R2 are used for referencing the results when you create the expression.
Result expression builder – day-night difference
Create the expression
Having chosen the Results sets, you create the expression. Under Expression, click Enter a new expression and type R1-R2 (not case-sensitive), i.e. the difference between daytime and night-time levels. You can give this a name, eg Day-Night diff.
Click OK to close the Expression Builder. Note that the Receiver Result Display Parameter window now shows that the result set is ‘Result Expression’ and the Result/Expression window is showing the expression you entered, or its name if you gave one, in this case, Day-Night Diff. Click OK to close the window and you will now see that the receiver results show the difference between day and night levels at each receiver.
Result expression selected as headline value
MULTIPLE RESULTS LOADING
You may need to compare the results from two different results sets. For instance in the present example, between the Base Scenario and the ‘With New Road’ scenario.
We already have ‘Baseline’ loaded, so we need to load the ‘With New Road’ scenario. Select Calculate>Load Receiver Results from the menu and in the Receiver Results Explorer choose With New Road Scenario. Select CRTN and load the With New Road Results.
The Receiver Results Display Parameters window opens. Click the Expr button. Now we need to add the new scenario to the results list. Click Select a result set and choose With New Road Scenario. Note that this is shown as Result set R3. Select the appropriate index, say Lday, and in the combination column, select ‘All Roads’
Now you can create a new expression R3-R1 and perhaps call this DS change (Do-something change). Click OK and you will see the new expression shown in the Receiver Results Display Parameters window. You can switch between the two expressions to display or export the result as necessary.
More complex expressions can be entered as shown earlier.